
So here’s the guts of my ISS, which may or may not ruffle feathers.
Asset Allocation
My timescale is long, my employment is (in theory) secure and my pension scheme is (supposedly) generous. All money going into my portfolio is that which I can afford to lose. My current lifestyle, while not extravagant, is comfortable and by limiting lifestyle inflation I hope to increasingly channel spare cash into investments. I’m happy to take a reasonable amount of risk in my portfolio on this basis.
In choosing my asset allocation split I’ve tried to read widely, including the usual Smarter Investing 3rd edn – Tim Hale, Monevator etc (1, 2, 3). There’s an argument that given my timeline is 15+ years I could go wholly into equities, however I’m going to try and include my whole net worth in the picture.
Allocation will initially be set at 70% equities, 15% cash, 10% alternative or exotic assets, 5% property (4, 5, 6). Equities are split between a core 80% passive tracker portfolio and a testbed active portfolio (10% active funds, 10% stocks) aimed for growth. Allocations will be reviewed and re-balanced quarterly. Re-balancing will be covered in Part 4. Cash holdings will target high interest and liquidity, through usage of high interest current and savings accounts with FSCS cover. Alternative and exotic assets will be covered separately. Property is currently equity in our own home, but will encompass owned property plus REITs.
Fund/Brokerage Allocation
I intend to allocate across ETF/ fund providers. Rules here are loose, but the intention is that no provider will hold more than 25% of my holdings. To minimise risk I’ll also allocate across brokers, with the intention of simultaneously reducing TER and minimising tax burden (7).
World Allocation
It would be very simple to put all my money in a LifeStrategy 100 and be done with it, but I’m a contrarian at heart. As fits a diversified passive-focus portfolio the central core of my global equity allocation will mirror world markets, using all world tracker funds and ETFs (8). Beyond this statement and with caveats for other sections of my portfolio I diverge from the norm.
Testbed Active Portfolio
This section of my portfolio is largely UK-based, and a mixture of 10% stocks and 10% active funds I find interesting. Themes here are disruptive companies, and early investing and venture capital, counterbalanced with commodities. I will explain more about this in a separate post.
Core Passive Portfolio
My global allocation aligns to two main beliefs:
- Broadly match global market capitalisation (so far so normal)
- Global market capitalisation reflects top-heavy population demographics (… que?)
I understand the broad investment logic behind investing in your own country, and holding trackers to your domestic market. The protection against inflation a home market affords (9, 10). I too feel the deep rooted psychological reasons for supporting UK industry.
But much of my active testbed, cash, property and other assets are in the UK. I’m already 40-50% UK inflation vulnerable/protected before even looking at passive equities. I’m therefore ex-UK in my passive section. The sensible answer would be an Ex-UK All-World Tracker. But then how do you slice your pie? Contribution to Gross World Product? Global market capitalisation? If global cap whose data do you use?
My figures are a blend of the above taken from a seeking alpha blogpost, the PWC yearly report plus the Credit Suisse Yearbook (11, 12, 13, 14). Factoring in ex-UK active investments with the passive core I aim to hold:
- 40% US
- 35% Emerging Markets
- 15% Developed Ex-US/ Ex-Euro
- 10% Euro
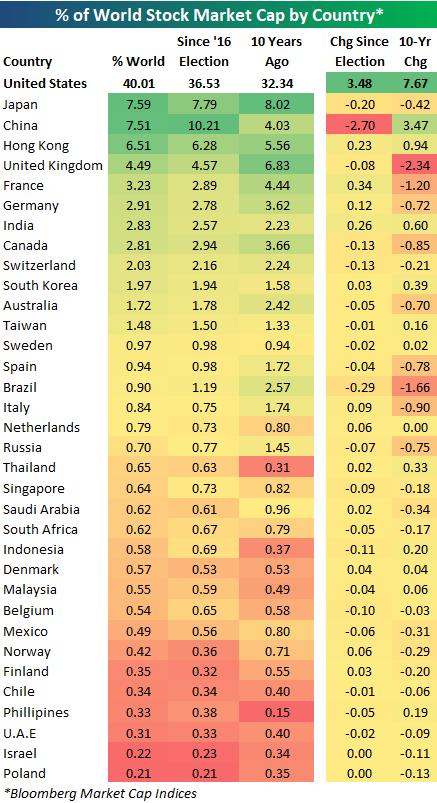
Standard All-World trackers hold heavily in the US, which I consider to be over-valued for a number of reasons I won’t go into here. China ranks second in PWC and third in Bloomberg Global Market Caps, with India closing the gap (11, 12) . I aim to capture these as part of a quite aggressive 35% emerging market weighting (15, 16). Emerging markets appeal for a number of reasons, but one I really favour is young demographics. This is also the reasoning behind my 15% targeting Developed Ex-US and Ex-Euro markets. Here, like Firevlondon, I’m looking at English-language Commonwealth nations with expat potential, favouring Australia and Canada (17). These markets also have a sector mix which balances the tech and service heavy US/ Eurozone.
In summary
Despite all my waffling, it’s probably a fairly stock allocation profile. 40-odd percent in the UK, 20-30% in the US, with the rest scattered about the developed and emerging markets. I’ll review this yearly with new world data to see what changes need to be made.
In Part 4 – Funds, Accounts and Rebalancing.
References:
- https://amzn.to/2Sthjtv
- https://monevator.com/asset-allocation-construct/
- https://www.bogleheads.org/wiki/Asset_allocation
- https://monevator.com/asset-classes/
- https://youngfiguy.com/how-i-invest-my-money/
- https://en.wikipedia.org/wiki/Alternative_investment
- https://www.bogleheads.org/wiki/Asset_allocation_in_multiple_accounts
- https://monevator.com/investing-for-beginners-the-global-stock-market/
- https://www.investopedia.com/articles/basics/10/protect-yourself-from-inflation.asp
- https://youngfiguy.com/how-i-invest-my-money/
- https://seekingalpha.com/article/4202768-u-s-percent-world-stock-market-cap-tops-40-percent
- https://www.pwc.com/gx/en/audit-services/assets/pdf/global-top-100-companies-2017-final.pdf
- https://monevator.com/world-stock-markets-data/
- https://indeedably.com/home-market-bias/
- https://monevator.com/emerging-markets-index-fund/
- https://www.investopedia.com/terms/e/emergingmarketeconomy.asp
- https://firevlondon.com/2015/06/17/my-ips-2-of-5-asset-allocation/

Hi,
Interesting article on allocations. Do you have any way of backtesting your data to see what the potential returns would be? Something like this? https://obviousinvestor.com/my-investments/growth-portfolio/portfolio-comparison/
I find it helps to test allocations in different assets to see how they performed in the past. I’ve not been able to find enough data for UK and EU based assets to do much backtesting though so if you have any sources please share.
Just found your blog and enjoying the read so far. Thanks!
Cheers,
Mark
LikeLike
Hi Mark,
I’ve run some rough numbers privately (including through Firecalc), but not formally backtested the portfolio. This is something I’ve thought about, but a) is more difficult as my sector allocations are relatively new (lots of trackers etc), and b) I’m not convinced the past returns would provide predictive value on my future returns. Your comment is motivation to actually run some proper tests and publish a post on it.
Your blog looks really interesting, with a very different strategy to my own. I look forward to following with interest!
Thanks for reading,
The Shrink
LikeLiked by 1 person
Thanks for the reply!
Personally it just makes me feel more comfortable if a I can see that strategy like my Growth Portfolio has returned almost 10% for 15-20 years or more. Although as you say, it doesn’t mean it will do the same in the future, however it’s all I have, and for me it gives more confidence in the strategy then just guessing.
Either way, you’re doing great and I’m sure will continue to do so!
I’ll be paying frequent visits to your site too 🙂
Cheers,
Mark
LikeLiked by 1 person